
Sections on this page (click icon at right to open/close list)
Sample pathway graphs
During the 2008 ITiCSE Working Group, group members explored the analysis approach of using the tool NVivo to develop pathway graphs. Please see the Working Group report for a full discussion.
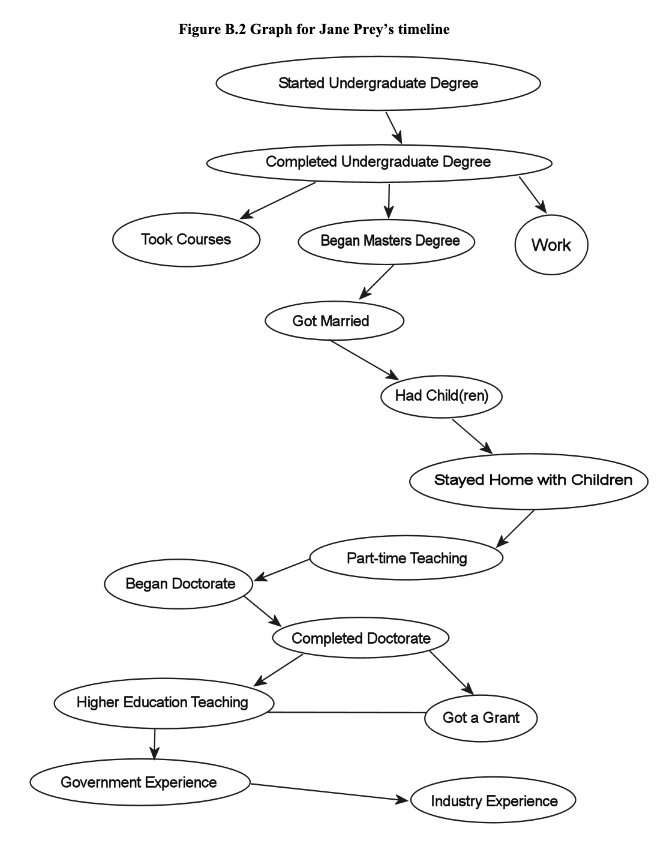
In the following, each oval is a node (a theme that comes up during an interview) and represents a particular milestone or event. Triangles represent events that are unique to the individual on whose graph they appear. Lines with arrows show linear sequences of nodes. Lines with no arrows connect nodes for which the associated milestones or events occurred simultaneously.
Pathway graph for Jane Prey’s timeline
Overview page for Jane Prey’s interview
Pathway graph for Nell Dale’s timeline
Overview page for Nell Dale’s interview
